Crop Frequency Report
What is a crop frequency report?
The Crop Frequency report provides a range of maps and information regarding the presence and frequency of crops for up to a 10-year period for the selected Lot(s) on Plan.
The locality map (below) shows the regions of Queensland for which the report is currently available.
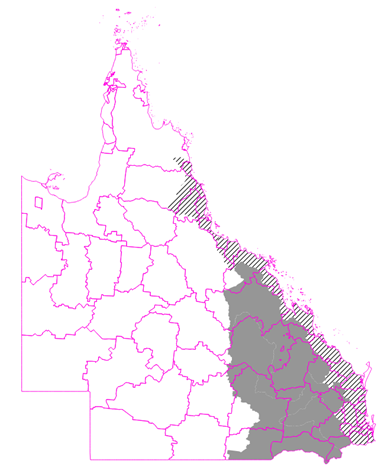
Locality map showing regional availability. The grey area indicates the availability of both summer and winter crop information for the report. The hatched area indicates summer-only crop information.
What is included in this report?
The Crop Frequency report includes:
Crop Frequency map (page 1)
- Annual crop-frequency mapping, based on time-series analyses of Landsat (1990 to present) and Sentinel-2 (2015 to present) satellite imagery. (Note: Coarser resolution MODIS imagery (2000 to 2021) is used when neither Landsat nor Sentinel-2 has scanned an area for ≥3 weeks.)
- A total crop frequency – for example, a frequency of ‘5’ indicates that there have been 5 crops for the entire time period specified, which can be made up of either summer-growing crops or winter-growing crops.
Note: The presence of blue polygons (if any) indicates the maximal area of known dams, earth tanks, lakes and reservoirs, according to existing data.
Frequency maps for summer- and winter-growing crops (page 2)
- Shows the frequency of crops over the summer (November of the previous year to May) and winter (June to October) growing seasons.
- This is a count of the number of times an active crop was detected in each of those growing seasons.
- The detection of active crops is based on, as above, time-series analysis of Landsat, Sentinel-2 and (possibly) MODIS imagery.
Frequency of individual crop groups (pages 3-5)
- Summer-growing crops are grouped as ’banana’, ’cotton’, ’sugarcane’, and ’other’ (predominantly sorghum and maize, but may also include mungbean, peanut, and soybean).
- Winter-growing crops are grouped as ’cereal’ and ’chickpea’.
Note: Where these areas have been covered by water for the majority of a growing season, they display as 'whitespace' in the corresponding composite satellite image (i.e. they have been excluded from analysis).
Composite satellite images (page 6 onwards)
- A time-series composite satellite images.
- Cropped areas will generally appear bright green in these images compared with the surrounding landscape.
- Occasionally (after very wet seasons), pastures (and the entire landscape) might also appear bright green which may cause errors in mapping crop area.
Proportion graph of area assessed as crop (final page)
- A graph showing the proportion of the Lot(s) on Plan or selected area that was cropped in summer (November of the previous year to May) and winter (June to October).
- A data file is included in the report email containing the time-series graph data in a CSV file, which can be opened in an Excel spreadsheet.
Report sample
Report sample is available online here (PDF, 8.5 MB).
A data file containing the time-series graph data in a CSV file, which can be opened in an Excel spreadsheet. Example
A more detailed description of the Crop Frequency report is available in the FORAGE User Guide (PDF).
Common questions about the Crop Frequency report
- An estimated total crop frequency map (page1)
- Estimated frequency maps for summer- and winter-growing crops (page 2)
- Estimated frequency maps of individual crop groups (pages 3-5)
- Composite satellite images, to help visually cconfirm the presence/absence of a crop (page 6 onwards)
- Graph of the proportional area assessed as crop for summer/winter (final page)
- A data file containing the proportional-area time-series data in a CSV file, which can be opened in an Excel spreadsheet.
Information in the Crop Frequency report can assist with:
- An objective opinion on a property's history when buying, selling, investing, or querying rate evaluations
- Demonstrating, for example, high-value landuse to respond to a development proposal (e.g. gas wells, road/rail planning)
- Demonstrating crop activity with: climate variability, seasonal crop split, indicative crop vigour and size/extent of crop
- Indication of crop type over time
- Identification of adjacent water bodies.
For more information regarding the Crop Frequency report, see the FORAGE User Guide.
References that may be of interest include:
Pringle, M., Schmidt, M., and Tindall, D. (2018). Multi-decade, multi-sensor time-series modelling - based on geostatistical concepts - to predict broad groups of crops. Remote Sensing of Environment, 216, 183-200.
Pringle, M. (2021). Detecting the annual extent of sugarcane crops in Queensland, Australia. Remote Sensing Applications: Society and Environment, 22, 100496.
Subscription option
Periodic subscriptions (1, 2 or 3 months) are available for this report. See here for more information on how to subscribe and unsubscribe.
